
Founders get plenty of LinkedIn advice: how often to post, what to post, which formats are working this month. Very little of it shows what founders really do. I wanted to see that with real numbers.
I chose Y Combinator not only for its reputation as one of the preeminent tech accelerators, but also because it has become a source of inspiration and guidance for GTM and growth marketing practices more broadly.
So in August 2026 I pulled every public LinkedIn post from every founder with a LinkedIn profile at a YC 2025 B2B company based in the US and Canada, across all four 2025 batches. That came to 646 founders at 329 companies, and 14,005 original posts written between January 1, 2024 and August 12, 2026.
What is Y Combinator (YC)?
Y Combinator (YC) is a startup accelerator in San Francisco, founded in 2005 by Paul Graham, Jessica Livingston, Robert Morris and Trevor Blackwell. It invests in very early companies, often before they have a product or revenue.
Founders apply and, if accepted, join a batch. There are four batches a year: Winter, Spring, Summer and Fall. Each runs for three months, with founders working on their company in San Francisco alongside YC's partners and the rest of the batch. It ends with Demo Day, where every company presents to a large room of investors.
The standard deal is $500,000: $125,000 for 7% of the company, plus $375,000 on terms set by the company's next round. YC charges no fees and sets no milestones.
Companies that came through YC include Airbnb, Stripe, Dropbox, Coinbase, DoorDash, Reddit, Instacart, GitLab and Twitch. YC puts the combined valuation of its best-known companies at $1.3 trillion.
I didn't go in looking for a particular answer. I counted, then looked for patterns. What surprised me most was how few of these founders post at all, given the launches, rounds and hires they have to talk about. The rest of this piece is what the data showed, and what you can take from it for your own posting.

The numbers at a glance
How often do these founders post on LinkedIn?
Over the 12 months to August 12, 2026, the median YC 2025 B2B founder posted 0.25 times a month, about one post every four months.
See the numbers: how many founders post, and how often
| Posting level | Founders | Share of 646 |
|---|---|---|
| Posted at least once since January 2024 | 513 | 79% |
| Posted in the last 90 days | 284 | 44% |
| Two or more posts a month, and posted in the last 90 days | 99 | 15% |
| Four or more posts a month (roughly weekly) | 61 | 9% |
| Six or more posts a month | 30 | 4.6% |
Most of these founders have posted at some point, but consistency is where the gaps start to show. 44% of the founders posted in the last quarter, and 15% keep up two posts a month.

How often do you need to post to stand out?
In this group, twice a week is enough to lead. Two posts a week puts a founder ahead of 98.6% of YC 2025 B2B founders. Nine founders post that often, and four post three times a week or more.
The most active founders in the census:
- Harsha Gaddipati (Slashy): about 24 posts a month
- Andrew Yan (AthenaHQ): 21
- Emilio Andere (Wafer): 15.5
- Mark Hughes (Solidroad): 14.4
The most active 10% of founders wrote 55% of all 14,005 posts, and 30 founders have 100 or more posts each. The least active half, 323 founders, wrote 497 posts between them (3.5%). None of them posted more than six times since January 2024.

How does company size impact a founder's LinkedIn activity?
Founders at bigger companies post more, by a wide margin. Those at the largest companies in the group are four times as likely to post consistently as founders at the smallest.
Team size is what each company self-reported to YC, captured in August 2026. It's on record for 628 of the 646 founders.

The share climbs at every step. The data can't say which way it runs. A bigger team may free a founder up to post, founders who post may find it easier to hire, or both. It does show that founders on the smallest teams are the least likely to post consistently.
Do founders post more after YC?
Among the 513 founders who have posted since January 2024, the median rate went from 0.05 posts a month before their batch to 0.55 after, about eleven times as often.
- 87% of them posted more often after their batch started than before.
- 237 (46%) made their first post after their batch began.
Counted across all 646 founders, between 8% and 16% posted in any one of the 12 months before their batch. In the month after it started, 41% did. In the ten months after, it never dropped below 24%.

This is a before-and-after count, so it can't prove YC caused the jump. But the timing lines up with what these founders were posting about: getting in, raising, launching. It looks like YC funding news is, at least in part, what kick-starts typically quiet founders into posting more than they used to.
What kind of LinkedIn posts get founders the most engagement?
The two post types that get the most engagement are funding announcements and getting into YC. A funding post gets 3.8x the engagement of that founder's typical post, and a YC acceptance post 3.3x. So if a founder's posts usually get 50 reactions and comments, their funding post would get about 190.
Every comparison here is a founder against their own typical post, never against other founders, because comparing across people mostly measures audience size. Engagement means reactions plus comments.

See the numbers for each announcement type
| Announcement type | Vs the founder's typical post | Founders whose announcements beat their typical post |
|---|---|---|
| A funding round | 3.8x | 77 of 89 |
| Getting into YC | 3.3x | 80 of 86 |
| A revenue or customer milestone | 2.0x | 24 of 34 (small sample) |
| A hire (hiring, or someone joining) | 1.6x | 73 of 95 |
| A launch | 1.4x | 92 of 134 |
| A new feature | 1.2x | 60 of 107 |
Here's what these posts look like. The five below are standouts, picked to show one of each type, so each did far better than a typical announcement:
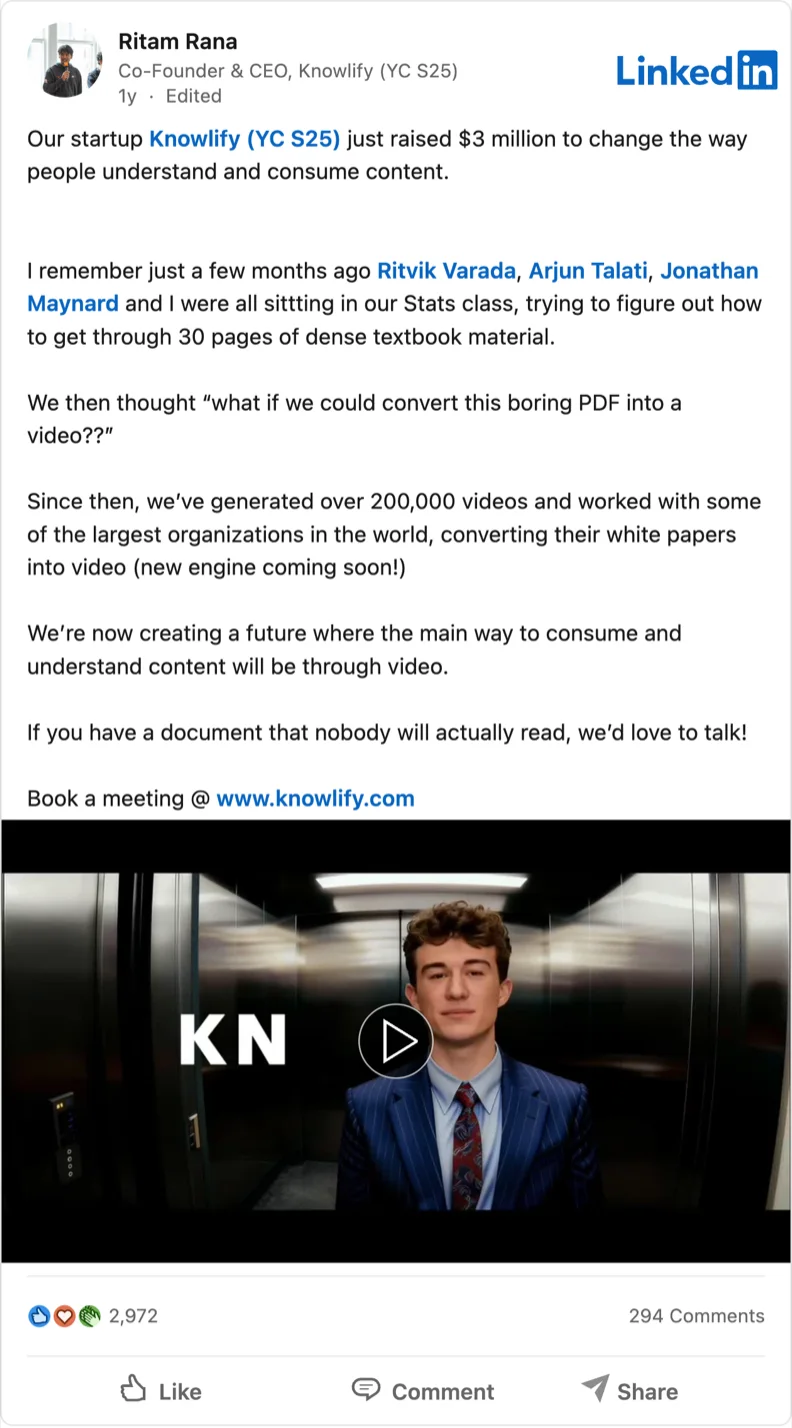
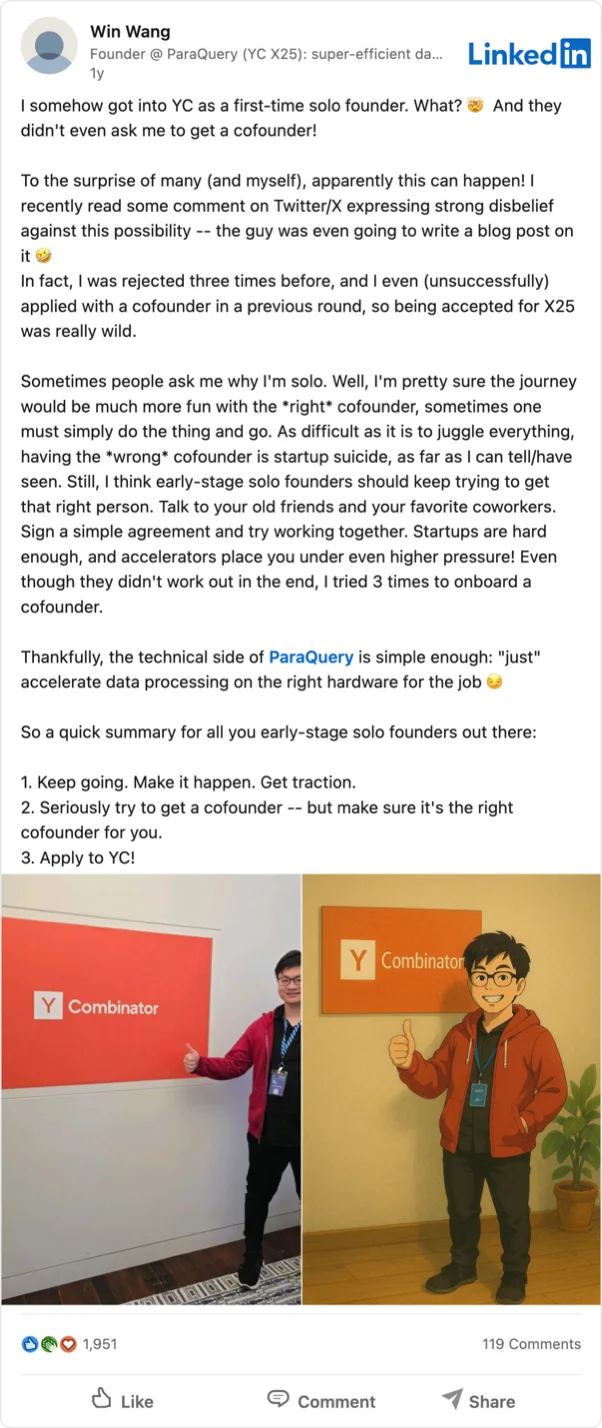
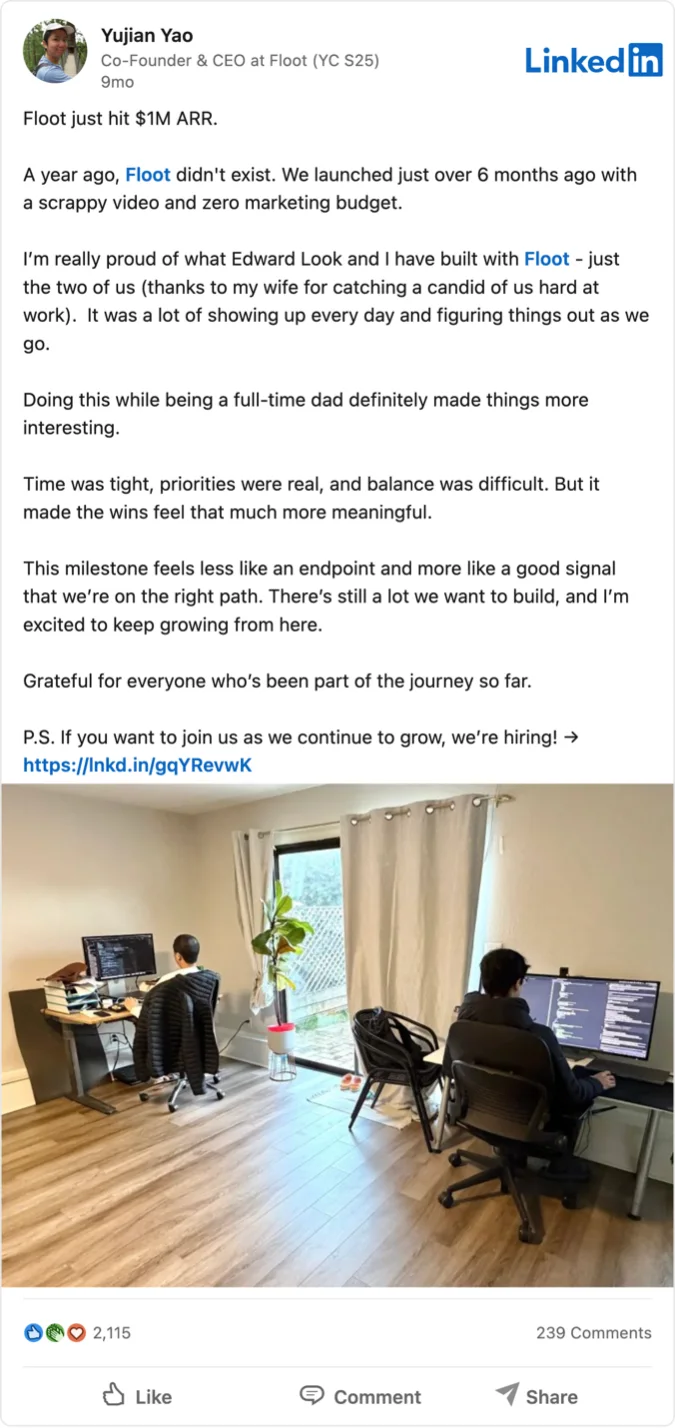

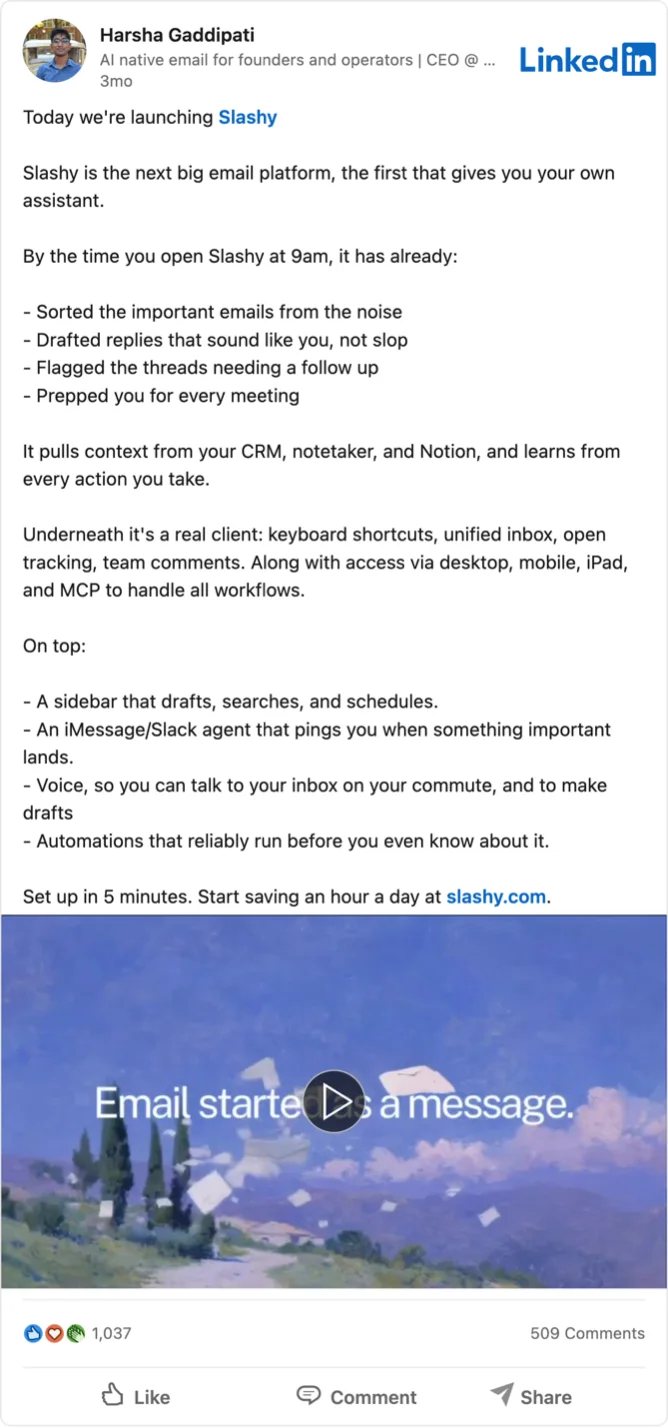
New features sit at the bottom. Only 60 of 107 founders saw their feature posts beat their typical post, barely more than half.
Which post formats get more engagement?
Posts that tag a person do best, at 1.74x the founder's own typical post. Link posts do worst, at 0.70x.

See the numbers for each format
| Format or writing choice | Vs the founder's typical post | Founders above their typical post |
|---|---|---|
| Tags a person | 1.74x | 248 of 286 |
| An image | 1.38x | 223 of 315 |
| A video | 1.12x | 111 of 196 |
| Under 500 characters | 0.88x | 124 of 301 |
| Text only | 0.74x | 60 of 203 |
| A link post | 0.70x | 45 of 175 |
Most founders who tag people see those posts beat their usual. Image posts beat the usual for most founders (223 of 315). Video posts do a little better than usual, for just over half (111 of 196). (For what's changing with video on the platform, see LinkedIn's new Video tab.)
Link posts are the weakest. About one founder in four (45 of 175) saw a link post beat their usual.
Do founders get more engagement in months they post more?
In total, yes. I compared each founder's busiest third of months with their quietest third. A quiet month typically had one post and a busy month four to five. In the busy months, each post got 0.65x the engagement of the quiet month's post, but the month as a whole got 3.2x.

That's reactions and comments, not reach: LinkedIn doesn't publish impressions.
What this data can't tell you
- Engagement is attention, not results. Reactions and comments don't measure pipeline, revenue or hires. They're the only signal public at this scale. (If pipeline is the question, here's how to measure it.)
- There are no impressions or follower counts. A founder with a big audience and one with a small, engaged audience can look the same. Comparing founders with themselves reduces that problem; it doesn't remove it.
- It's correlation, not cause. Founders who post more may differ from founders who don't in ways I can't see.
- Keyword sorting misfiles some posts. Treat the announcement and format numbers as direction, not precise multipliers.
- It's one group. These are funded YC founders. Other founders may look different.
How this was measured
- Who: 646 founders with a LinkedIn profile, from 329 YC 2025 B2B companies based in the US and Canada: Winter 2025 (165 founders), Spring 2025 (145), Summer 2025 (193) and Fall 2025 (143).
- What: 14,005 original posts from January 1, 2024 to August 12, 2026. Reposts are excluded.
- When: posts collected in August 2026. Only public posts are included.
- Engagement: reactions plus comments, captured on August 12, 2026.
- Posting frequency: measured over the 12 months to August 12, 2026.
- Posts consistently: averages two or more posts a month over those 12 months and posted in the last 90 days.
- Announcements and formats: posts classified by keywords in their first 200 characters, and each founder's posts of a type compared with that founder's other posts.
- Team size: self-reported to YC, captured August 2026, on record for 628 founders.
I shared three stat cards from this data on LinkedIn in August. The figures here come from a fresh run of the raw data on October 30, 2026, with a stricter way of sorting announcements, so a few of them differ from those cards.
Where is the opportunity for founders on LinkedIn?
It can feel like every founder is on LinkedIn, posting every day. In reality, despite the sea of posts, very few maintain consistency. Of the 646 founders here, 79% have posted at some point, and only 15% post twice a month or more over a whole year.
So the bar for consistency is lower than it looks. Two posts a month, kept up for a year, puts a founder in the top 15% of this group. Two a week puts them ahead of 98% of it.
So here lies the opportunity to build visibility, stand out from competitors, and get your voice heard.
None of this says posting will win you customers. My data stops at engagement, but if you've been holding off because you assumed every other founder was already out there every week, most of them aren't.
Twice a month we meet for a 30-minute live session. I turn it into short videos you can post. You stay consistent without writing posts every week.
Book a call →Questions people ask
How often do funded B2B founders post on LinkedIn?
Rarely. In a census of 646 YC 2025 B2B founders in the US and Canada, the median founder posted 0.25 times a month over the 12 months to August 12, 2026, about once every four months. 71% posted less than once a month, and 15% posted twice a month or more.
How often should a founder post on LinkedIn to stand out?
Among YC 2025 B2B founders, two posts a month kept up for a year puts a founder in the top 15%. Weekly puts them in the top 9%, and two posts a week puts them ahead of 98.6% of the group.
What kind of LinkedIn posts get founders the most engagement?
Funding announcements and getting into YC. Against each founder's own typical post, a funding post averaged 3.8x the reactions and comments and a YC acceptance post 3.3x. New-feature posts averaged 1.2x, and only just over half of founders saw them beat their typical post.
Do link posts do worse on LinkedIn?
In this data, yes. Link posts averaged 0.70x a founder's typical post, and only 45 of 175 founders saw a link post beat their usual. Posts that tag a person did best, at 1.74x.
Do founders post more after getting into YC?
Among the 513 founders who have posted since January 2024, the median rate went from 0.05 posts a month before their batch to 0.55 after. 46% made their first post after their batch began. This is a before-and-after count, not proof that YC caused the change.